Organic Traffic Insights brings you search data for up to the top 50 landing pages on your domain into one easy-to-access dashboard.
Organic Traffic Insights and Google Analytics
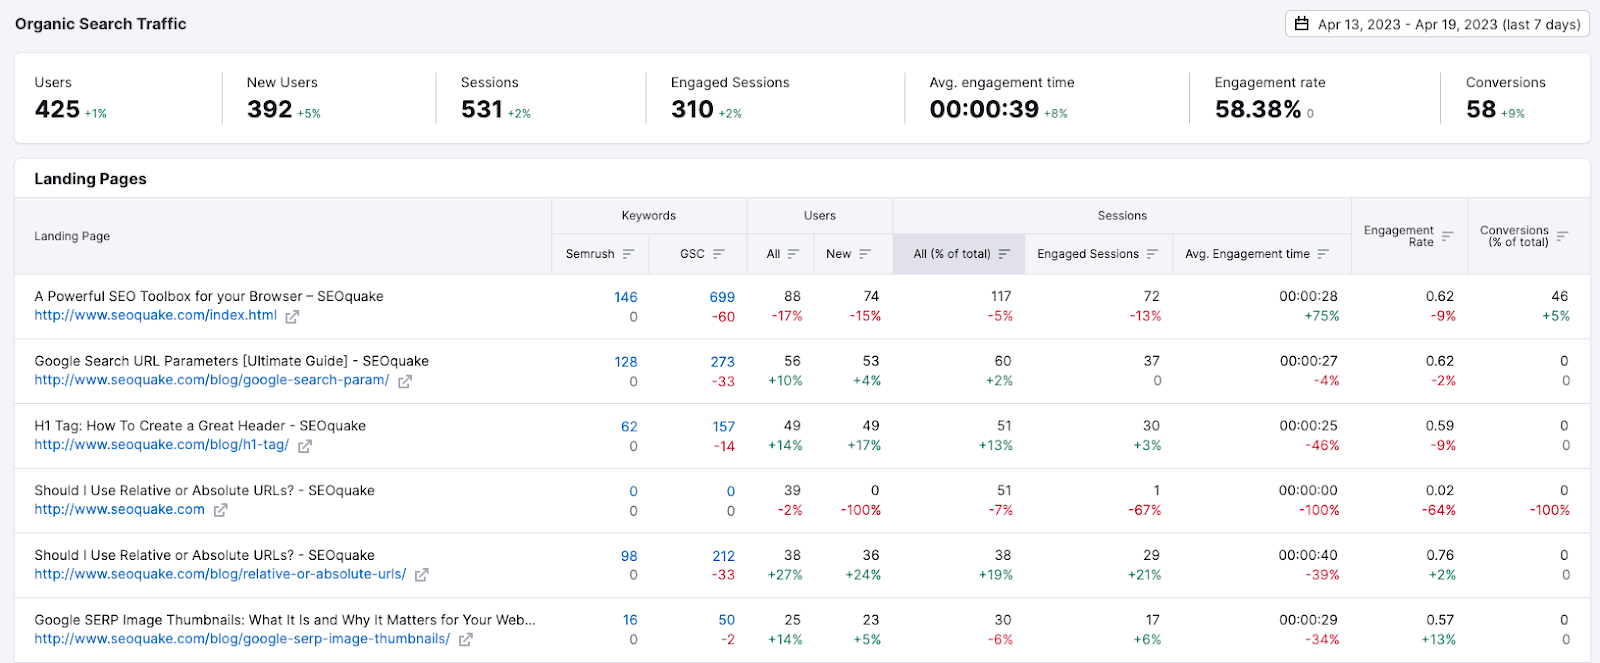
When you first open your report, you'll notice the Google Analytics metrics for each of the top landing pages on your domain. These metrics include total Users, New Users, Sessions, Engaged Sessions, Avg. Engagement Time, Engagement Rate, and Conversions. Each metric has its own specific benefit to your site’s SEO efforts, so they will be important to keep an eye on.

Users & New Users
Users represent the total number of unique users who logged an event.
This metric is a key component of your SEO efforts because it will tell you how many more or fewer people engage with your website over a period of time.
New users represent the Number of users who interacted with your site or launched your app for the first time.
The metric is measured by the number of new unique user IDs that logged the first_open or first_visit event.
When a new device or browser visits your website for the very first time, Google Analytics automatically identifies them as new users and saves the ID using browser cookies. When the same device or browser returns to your site at a later time, they will be counted as a returning user.
However, if a user clears their browser cookies or returns to the same website from a different browser or different device, this will count as a new user again. Both of these metrics are extremely important because they are telling you how successful you are at generating new visits to your site, as well as how often people are finding the need to return.
Sessions
Sessions represent the number of interactions between your users and your website or app within a specific timeframe. The default time frame of a “Session” set by Google is 30 minutes. So one returning user can log multiple sessions within a single day. However, you can customize this timeframe by changing the time frame that is set up in your Google Analytics account.
Engaged Sessions
An Engaged Session is a session that lasts longer than 10 seconds, has a conversion event, or has at least 2 pageviews or screen views.
This ratio will be valuable for marketers and analysts to trend over time. The higher the value, the more engaged users a site has.
Avg. Engagement Time
Avg. Engagement Time measures the “User Engagement Duration Per Session”, which is the amount of time someone spends with your web page in focus or app screen in the foreground. This can help you understand when users actively use your website vs. just having the page open in a tab but not displayed.
Average Engagement Time has replaced the old Average Session Duration from UA. That measured the duration of a user’s entire visit.
Engagement Rate
Engagement Rate shows you the number of sessions in which users engage with your site or app.
If your engagement rate is low, then consider using reports and explorations in Google Analytics to dig deeper to see whether it's uniformly low or whether it's the result of certain channels, source/medium pairs, pages or screens, or something else. You may also want to reevaluate your overall site design and examine the language, graphics, color, calls to action, and visibility of important page elements.
Conversions
A conversion is a user action that you count because you consider it important, such as a purchase, game level completion, or website or app scroll activity.
The primary way to measure a Google Analytics conversion is to create or identify an event that measures the important user interaction and then mark the event as a conversion. For example, if you use Google tag or Tag Manager, you would create the event for your website and then go to Google Analytics to mark the event as a conversion.
In Universal Analytics, goals are used to set up conversions. If you are migrating from a Universal Analytics property to Google Analytics 4, see how to migrate your goals to conversion events.
Reviewing Your Landing Pages
You can analyze the statistics for each of your top landing pages by traffic (depending on the country or device type) and see how many keywords each page is ranking for, along with GA metrics such as bounce rate/engagement rate, users, sessions, and Goal Completion %/Conversions of each. This helps you determine which pages are performing up to your standards and which ones have room for improvement.
In each landing page’s row, you can see the number of keywords associated with each page. These keywords are broken down into two separate sections: keywords found by Semrush and keywords found by Google Search Console.
Keywords
To analyze the keywords driving traffic to each page, simply click on the blue number in the Keywords column. This action will open the “Keywords” report for that page.
Possibly the biggest benefit you can gain from the Organic Traffic Insights report is access to your (not provided) keywords. These are the keywords that you can not see in your Google Analytics dashboard but are the source of the majority of your website's organic search traffic. This is important because these keywords are driving traffic to your site, and if you know what they are, you can optimize better for them accordingly.
Switch between viewing data from Semrush and Google Search Console, depending on what you want to analyze. When viewing the keywords within Semrush, you will see data for your position on the Google search results page, the keyword’s volume, keyword difficulty, traffic share, and the last time it was updated in our database.
Viewing the keywords under Google Search Console will show you the number of clicks, impressions, CTR, and average position
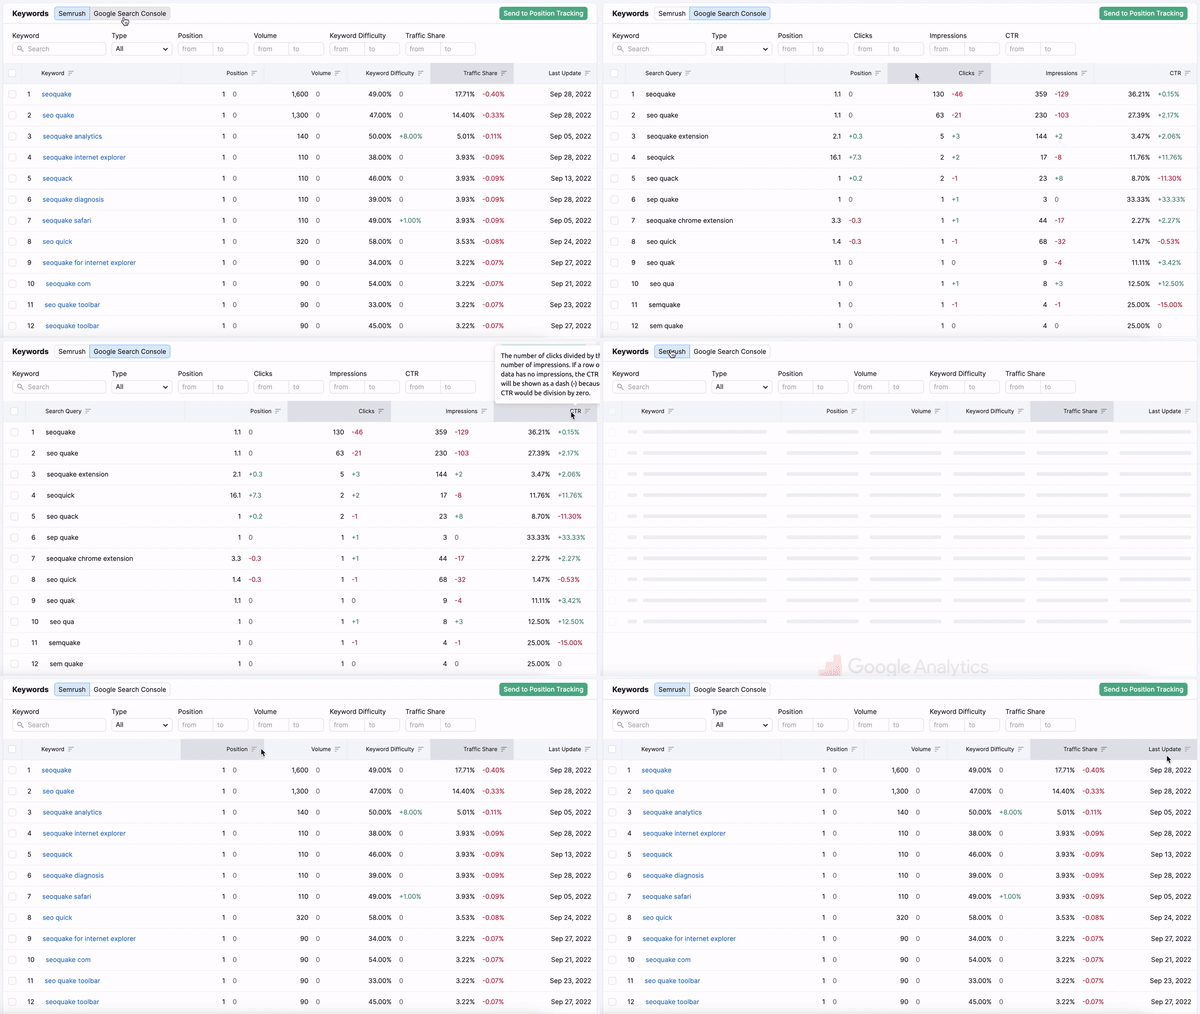
By switching back and forth between Semrush and GSC you are able to get a full understanding of how your landing pages are performing for certain keywords.
Above the list of individual keywords is a chart that shows how your landing pages and keywords were performing on a daily basis (this feature is for paid users only). This will allow you to see how your SEO efforts are impacting traffic to your site on a daily basis.

If you are running a new campaign specifically for this landing page and notice that your traffic hasn’t increased the way you intended, it could be an indication that you need to tweak your SEO strategy.
Filters and Sorting
If you are looking for a specific keyword, you can easily find it by using the search bar above the list of keywords. Not only can you filter your search by keyword, but you can also narrow down your list of keywords by page position, volume, and traffic share. All of this can be done with the filters located just above each data set.
You can also filter out any keyword by the keyword type. These types include new keywords, lost keywords, as well as winners and losers. This can help you determine which of your pages are gaining or losing positioning for your target keywords.
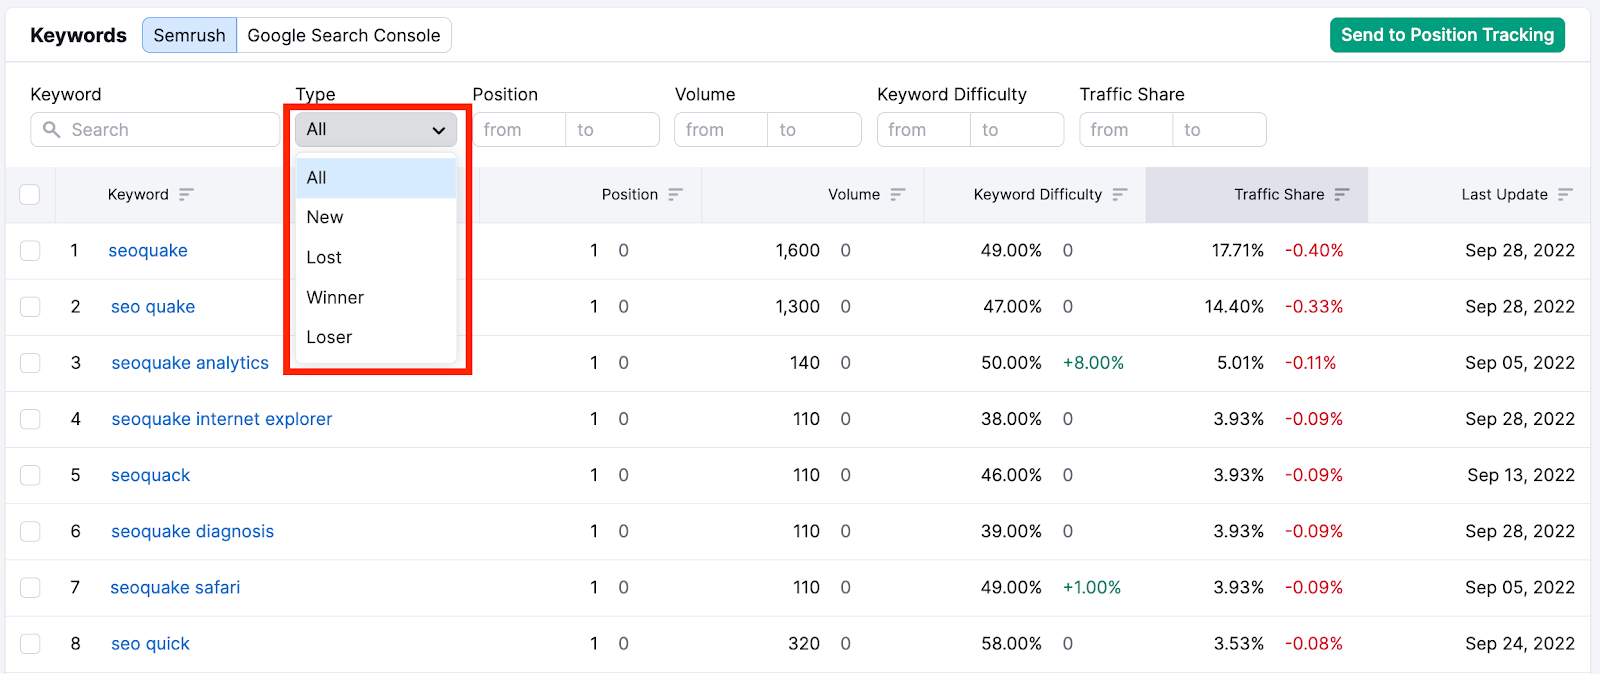
The red and green numbers located on the right show you the recent trend of each metric. Your default time period will be set to 14 days, but you can customize it in the calendar to be able to view trends of data over any desired time frame. If you are noticing that over the past 14 days, many of your analytics is trending down, it would be wise to take a look deeper into your campaigns to try and see what’s causing this negative impact.
Filtering Google Search Console data
One of the most helpful features of Organic Traffic Insights is the ability to filter your data connected from GSC. After clicking on your GSC keywords, you will notice all of the different filters: type, position, clicks, impressions, and CTR.
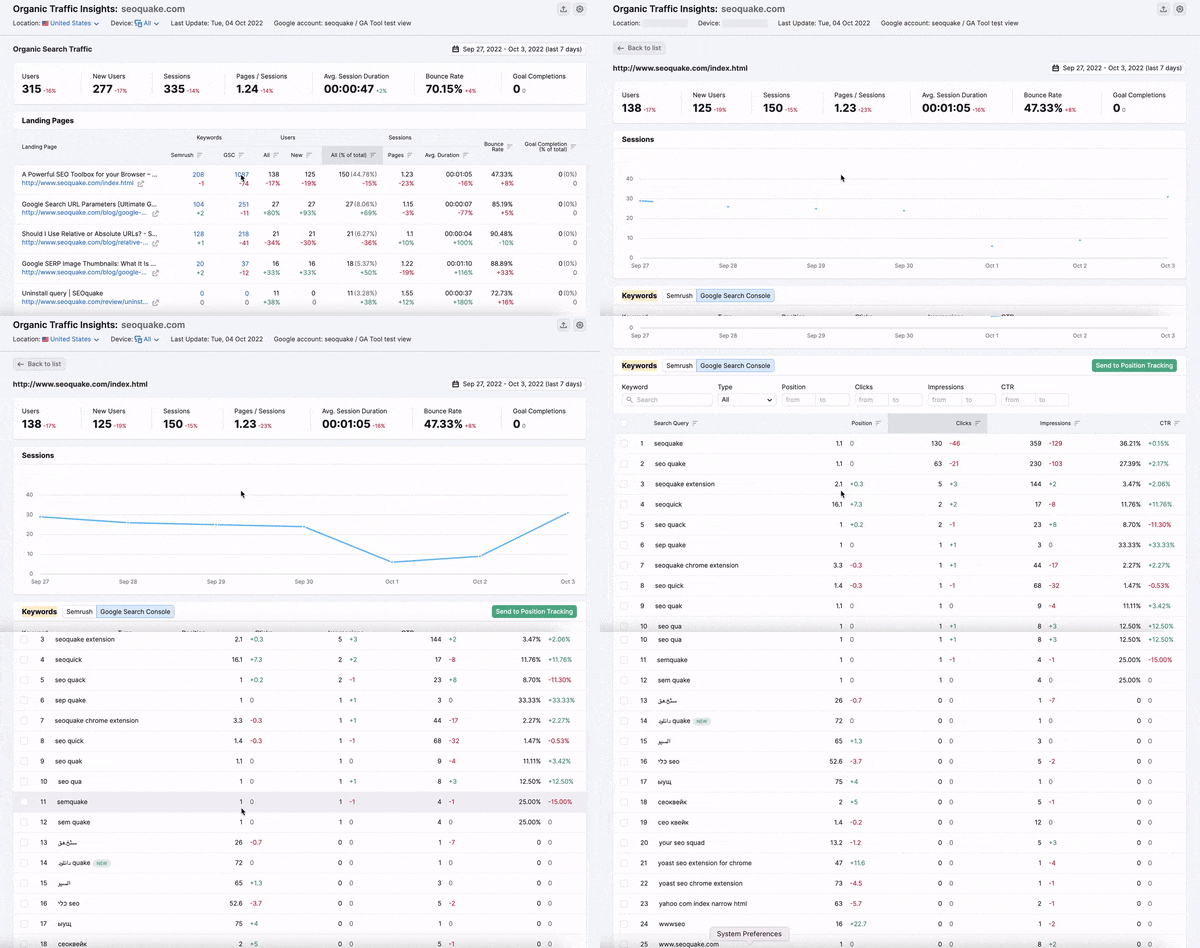
What makes this such a killer feature is that there are no filters in the Google Search Console interface, so this connection can give you that deeper insight. You can filter out by “type” to see which keywords are new, lost, winners or losers.
Send Keywords to Position Tracking
If you are looking to see how a keyword is performing compared to competitors, you can send that keyword to the Position Tracking Tool. Keep in mind that in order to do this, you must already have a Position Tracking campaign set up in a Project. To find out more about setting up Position Tracking, read Configuring Position Tracking.
You can select multiple keywords to send to Position Tracking if you want to analyze more than one. After you check the boxes for the keywords you want to analyze, simply click the green Send to Position Tracking button on the top right.
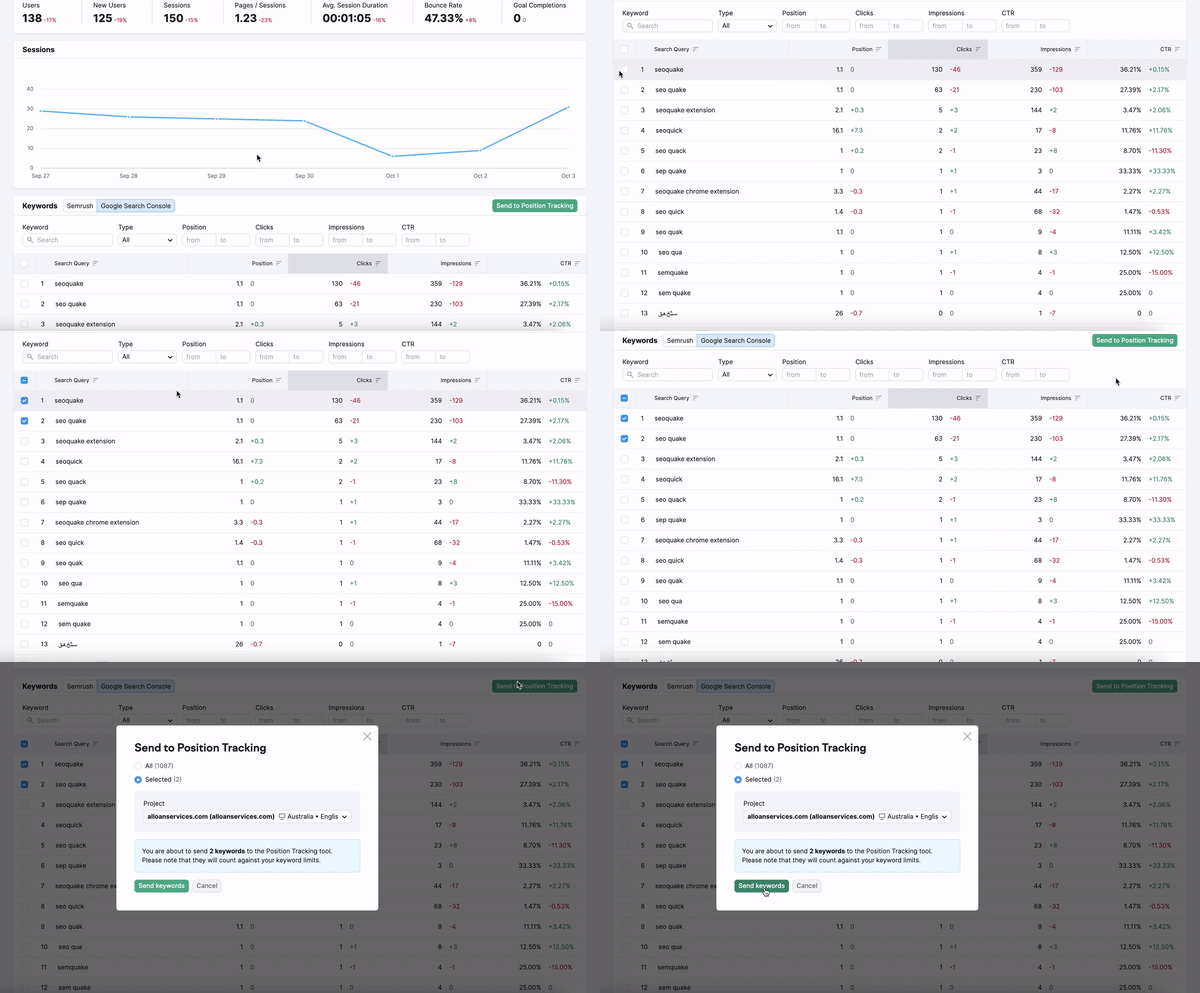
Having this option can be perfect if you are running a local campaign and are looking to see how the positions for your target keywords compare to some of your competitors on local Google SERPs. By combining data from Google Search Console and Semrush, you can guarantee that you are tracking the keywords that matter most to your website.
At any point, while reviewing this report, you can export both your landing pages/Semrush and landing pages/Google Search Console reports to either an Excel or CSV file.